Cybernated art is very important, but art for cybernated life is more important, and the latter need not be cybernated. - Nam June Paik
Monday, October 22, 2012
ORGANIZING DATA
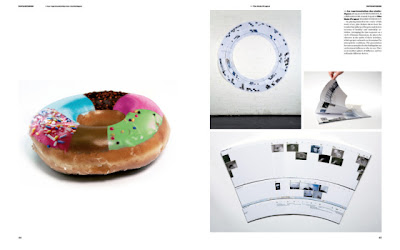
"Visual metaphors are a powerful aid to human thinking. From Sanskrit through hieroglyphics to modern alphabet, we have ciphers, objects, and illustrations to share meaning with other people, thus enabling collective and collaborative thought. As out experience of the world has become more complex and nuanced, the demands to our thinking aids have increased proportionally. Diagrams, data graphics, and visual confections have become the language we resort to in this abstract complex world. They help us understand, create, and completely experience reality." Introduction for the book DATA FLOW: Visualizing Information In Graphic Design by Gestalten.
DATANETS
DATASCAPE
DATANOID /\/\/\
DATALOGY VVV
DATABLOCK (-This is not apart of the book)
Narratives in Space and Time
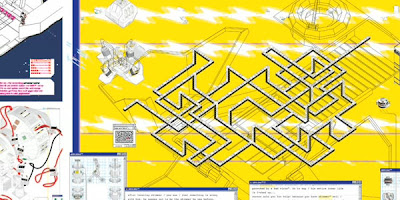
"Micro/macro composition also oversees celebrated 1930 poster composed by the Soviet graphic artist Gustav Klutisis. The design and the political point correspond-as the poster shows and also writes out, from collaborative work many hands, one great plan will be fulfilled. At work here is a critical and effective principle of information design." (Simular Ideas we was discussing about signals processing.)
DATA DATA DATA
“As the art being made has dematerialized and the world around us is increasingly information based, using data as another medium for artistic exploration seems not only possible but culturally necessary. The same tools used by corporations and governments to track our interests, desires, locations, and personal information can and are being exploited by artists to criticize, explore, and find poetic moments within the stream of data. This panel explores current approaches being used by artists working with data but with an eye to the past and culture. Since the available data sources range widely from weather patterns to stock-market trends to GPS locations and possible output spans all types of new and traditional media, this panel does not hone in one a specific issue but works as a survey connecting conceptual and critical points within this practice.”
Great Book: http://www.upress.umn.edu/book-division/books/database-aesthetics
Edward Tufte: http://www.edwardtufte.com/tufte/
http://jess3.com/
Edward Tufte: http://www.edwardtufte.com/tufte/
http://jess3.com/
Aaron Koblin: http://www.aaronkoblin.com/work.html
Penelope Umbrico: http://www.penelopeumbrico.net/
Brendan Dawes: http://processing.org/exhibition/works/redux/index.html
George Legrady: http://www.georgelegrady.com/
Jeffery Thompson: http://www.jeffreythompson.org/
Information Aesthetics: http://infosthetics.com/
Visual Complexity: http://www.visualcomplexity.com/vc/
Information is Beautiful: http://www.informationisbeautiful.net/
Processing.org: http://processing.org/exhibition/
Wednesday, October 17, 2012
OPEN SCREENING OCT. 26TH
Dear Creators of Media,
Arts Codec (New Media Student Arts Group) and I are hosting Open Screening Oct. 26th from 5:30-6:30 @ WieKamp 1001. Please note the time has changed.
Open screening is for everyone in the New Media Department or anyone interested in media. Anyone who produces any kind of electronic media is welcome (video, design work, digital photography, etc.). Please bring work in progress or finished work to share. Our goal is to strengthen the electronic arts community on campus and give us a chance to see what students, faculty, and staff are creating.
Please bring files on a thumb drive and make sure they are optimized for viewing (smaller file sizes are preferable). Be prepared to discuss your work and receive feedback.
DATAMINING THE SELF
To study the way is to study the self
to study the self is to forget the self
and to forget the self is to awaken to the ten thousand things.
- Dogen Zenji
DUE Oct. 22nd (10points)
DUE Oct. 22nd (10points)
Your assignment for this weekend is to collect data about your self, a journal of sorts. You can choose what types of data you collect. It could be you record everything you eat in the next 5 days, or you record activities you do every hour, or maybe you go through your home and record all that you own, or count the steps it takes to get from place to place, or maybe it is all about geographical locations you travel to from day to day, or numbers you interact with. I then want these posted to the blog in plan text for discussion Oct. 22nd. As a heads up you will be turning this data into your 3rd assignment.
Wednesday, October 3, 2012
EXPLORING NEW POTENTIALS OF SOFTWARE

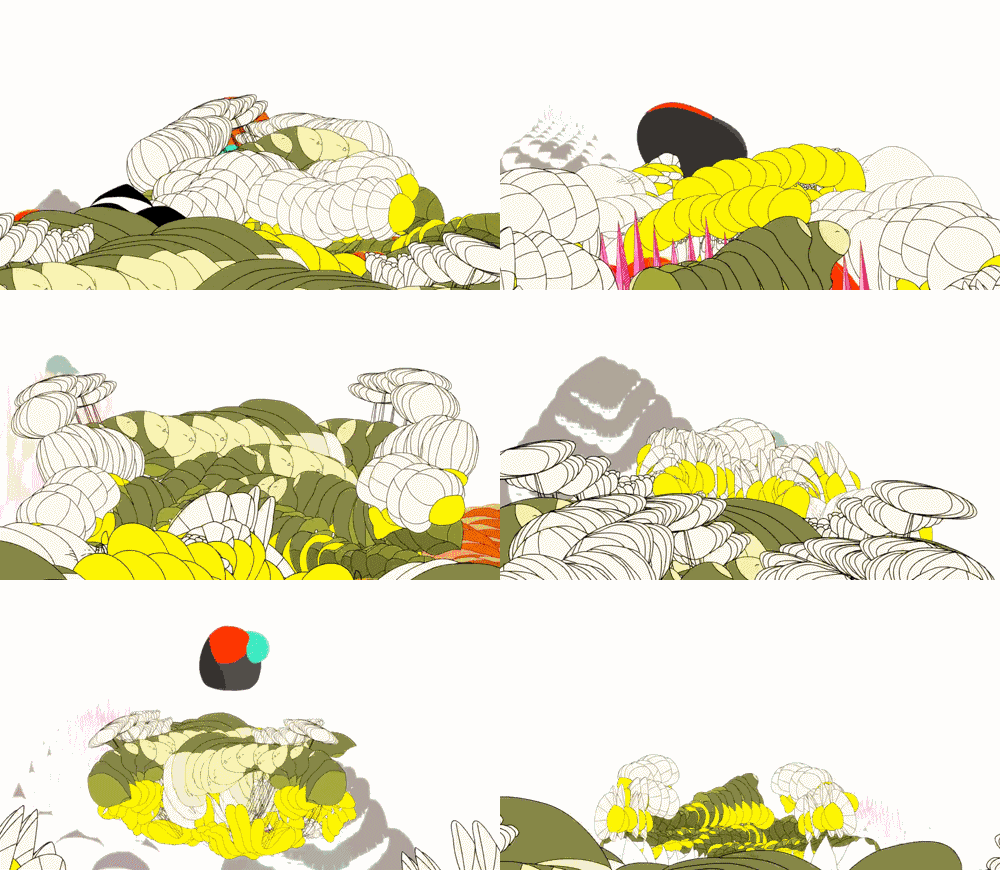
ANIMATED GIFFS & PROCESSING:
http://www.todayandtomorrow.net/2009/12/07/david-ope/
SUBVERSION
ASCII ART and other examples in class.
SUBVERSION
ASCII ART and other examples in class.
Monday, October 1, 2012
FAIL GRACEFULLY (Serious Play)
"Software interfaces define the boundaries of our work, but only exploration into the margins of these tools, beyond the intended use pattern can really expose these boundaries. In that sense in order for us to brake out of the design paradigm embedded in software we must use it "the wrong way" By all means, designers should be hackers, do what we're not supposed to, make your software fail, crash, burn... find the exploits of our tools, it's the only healthy and true relationship we can have with them. When we reach the boundaries and have learned enough, we can go and make our own tools, explore their failures, and excel within them. Like Offf's poster-child, Joshua Davis, who has built his custom made design tools and has developed his entire aesthetic style around these generative 'managed failures'." -Excerpt from Article
Subscribe to:
Posts (Atom)


